The COVID-19 pandemic has significantly increased the need for data analysis, done by many professionals around the world. Some might even say that data visualization is experiencing a breakthrough moment during this crisis.
Interestingly, the majority of the analysis done about the pandemic has been centered around the evolution of confirmed cases, deaths, and recovery rates around the world. Examples like the COVID-19 ArcGIS Dashboard by the CSSE at Johns Hopkins University are the most notable data visualizations being used around the world to keep track of case statistics.
While getting informed about the pandemic and looking at different visualizations shared on Twitter, I got very interested in learning more about what Twitter users around the world were tweeting in relation to the COVID-19 pandemic. This led me to start this quarantine project to do some text analytics on Twitter using R, the rtweet package, and the Twitter API.
Set up
This analysis was done using the rtweet R package while following a great tutorial by Laura Ellis (a.k.a. LittleMissData), which you can find here: Awesome Twitter Word Cloud in R
You can follow this tutorial using your local installation of R Studio or you can use a free, hosted, multi-language collaboration environment like IBM Watson Studio. If you’d like to get started with R in IBM Watson Studio, I’d recommend this great tutorial (also by Laura Ellis): Get Started with R (For Free) in IBM Watson Studio
Analysis
Once I got my word cloud R script working on my IBM Watson Studio Environment, it was time to start analyzing tweets from topics related to the COVID-19 pandemic. The easiest way to find related tweets was to search by hashtags.
Fun Fact 💡
Did you know that, according to Wikipedia, the use of hashtags was first proposed by Chris Messina in a 2007 tweet, that, altough initially decried by Twitter as a “thing for nerds”, eventually led to their use rapdily becoming widespread throughout the platform. Messina, who made no attempt to patent the use because he felt “they were born of the internet, and owned by no one”, has subsequently been credited as the godfather of the hashtag.
#coronavirus
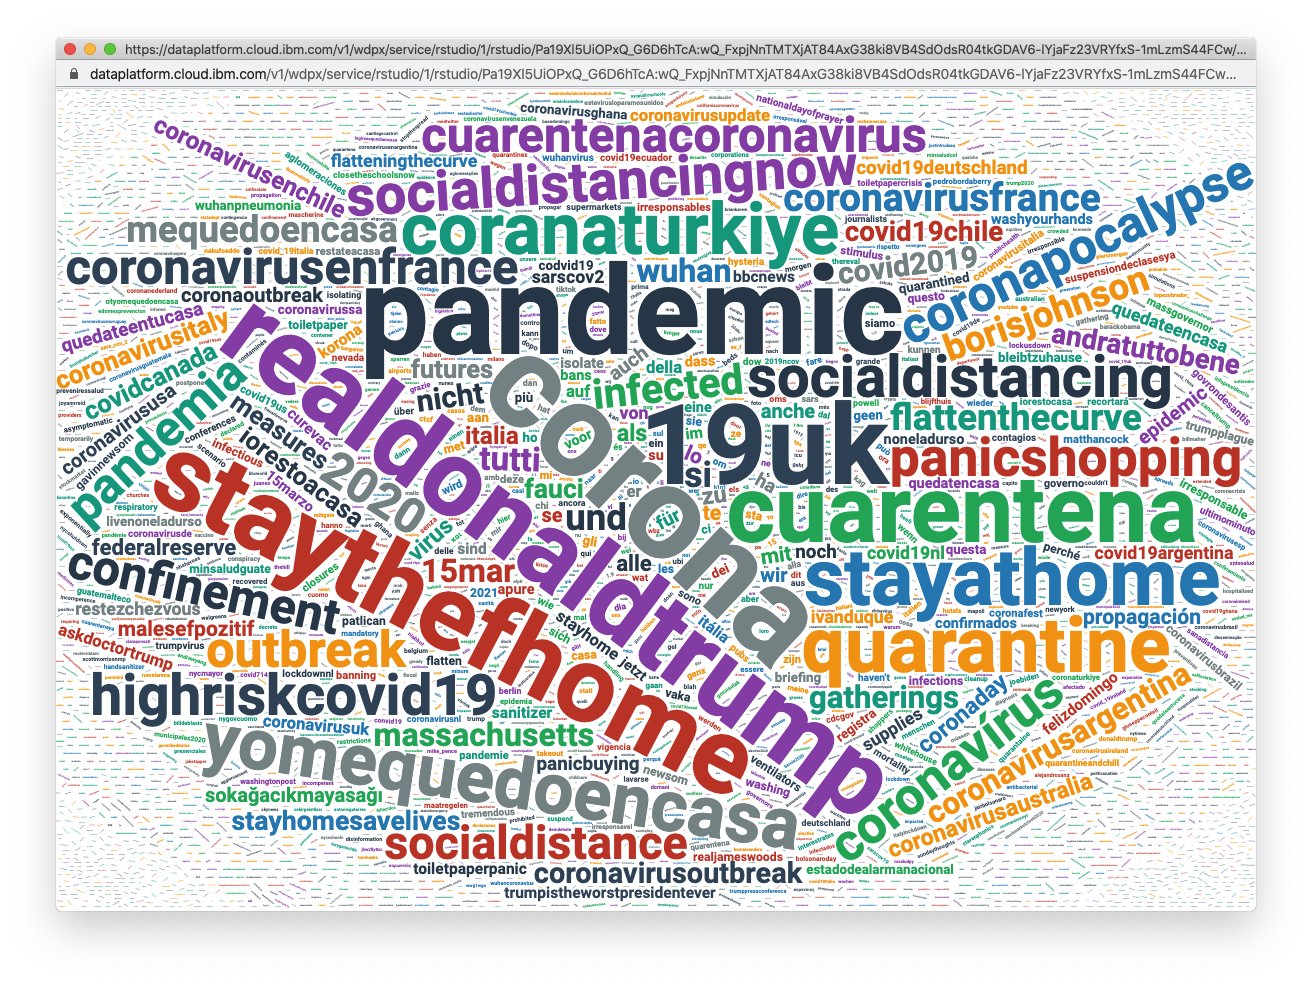
For this analysis, I used a sample of 5000 tweets including the hashtag #coronavirus.

As you can see from the word cloud above, it is important to remove redundant and dominant values (like the word coronavirus, in this example) to better analyze the word cloud. After removing these values, the new word cloud looked like this:
Observations
Here are a few observations I had after analyzing the results:
- Although I removed stop words (i.e. commonly-used words like “the”, “of”, etc.), I forgot to filter out stopwords in different languages (like “lo”, “si”, “von”, etc.). After doing some research, I found that rtweet supports stop words in multiple languages.
- It’s interesting to see the political influence around this particular subject by looking at the presence of words like realdonaldtrump, askdoctortrump, and borisjohnson.
- This sample was taken on March 15th 2020, right when most countries around the world were entering an extended lockdown period and promoting the need for social distancing, as shown by the presence of words like staythefhome, stayathome, restezchezvous, socialdistancing, cuarentena, mequedoencasa, etc.
- Due to the quarantine measures around the world, some countries experienced a surge in panic shopping (as shown by the presence of the word panicshopping). This can be verified using the Google Trends search below, showing a spike in Google Searches around the weekend of March 15th 2020.
Data & Resources
As mentioned before, the majority of the data analysis performed to date on the topic of COVID-19 has been done around case statistics. As pointed by Laura Ellis on Twitter, this is thanks to all the data heroes around who are working to make all the case data available and accessible to everyone.
This is the first twitter analysis I’ve seen on #COVID19
— Laura Ellis (@LittleMissData) March 16, 2020
It strikes me this is bc the focus has been on analyzing case stats.
🦸🏻♀️ 🦸♂️ And this is bc of the #data heroes who have made the case data so available and accessible. https://t.co/MHE9JguCbd
Here’s a list of the datasets and resources shared in the thread above, if you’re interested in doing further analysis:
- nCovid2019 R package by @guangchuangyu
- Coronavirus R package by @ramikrispin
- Covid Python package by Johns Hopkins University
- Covidify Python package by Aaron Ward
And a lot more resources being shared on Twitter with the hashtag #OpenData.
Special thanks to Laura Ellis (@LittleMissData) for sharing her knowledge and creating the tutorials that made this analysis possible.